Guidelines for Applying Normalization
Min-max scaling: Min-max scaling is suitable for algorithms that require input features to be within a specific range, such as neural networks and support vector machines. Make sure outliers are handled appropriately as they can affect the scaling.
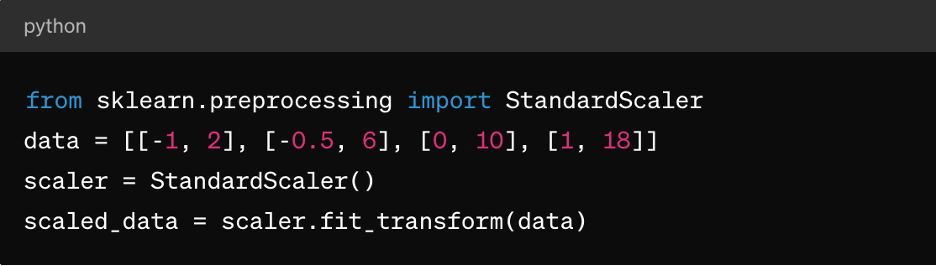
Z-score normalization: This is suitable for algorithms like k-means clustering, linear regression, and logistic regression. It results in a distribution centered around 0 with a standard deviation of 1, making it ideal for algorithms that assume normally distributed data.
Sparse data: For sparse data sets (where most values are zero), consider using techniques like MaxAbsScaler or RobustScaler for normalization.
Categorical data: For categorical features, consider techniques like one-hot encoding before normalization to ensure meaningful scaling.
It's important to note that the choice of normalization technique depends on the specific characteristics of your data and the requirements of the machine learning algorithm you plan to use. Experimentation and understanding the impact on model performance are key aspects of applying normalization effectively.
3. Feature Scaling
Feature scaling is a data preprocessing technique used to standardize the range of independent variables or features of a data set. The goal of feature scaling is to bring all features to a similar scale or range to avoid one feature dominating over others during model training or analysis. Feature scaling can improve the convergence speed of optimization algorithms and prevent certain features from having undue influence on the model.
Role of Feature Scaling in Data Preprocessing
Scaling features ensures ML algorithms treat all features equally, preventing bias toward features with larger scales. It also enhances convergences, as many optimization algorithms (e.g., gradient descent) converge faster when features are scaled, leading to quicker model training. It can also prevent numerical instability issues that may arise due to large differences in feature magnitudes. And finally, scaling can make it easier to interpret the impact of features on the model's predictions.
Feature Scaling Methods
In addition to the above-described min-max scaling and Z-score normalization, there is also:
MaxAbsScaler: This scales each feature by its maximum absolute value, so the resulting values range between -1 and 1. It’s suitable for sparse data where preserving zero entries is important, such as in text classification or recommendation systems.
RobustScaler: This uses statistics that are robust to outliers, such as the median and interquartile range (IQR), to scale features. It’s suitable for data sets containing outliers or skewed distributions.
Guidelines for Applying Feature Scaling
To apply feature scaling:
- Apply standardization (Z-score normalization) when the data follows a normal distribution or when using algorithms like linear regression, logistic regression, or k-means clustering.
- Apply normalization (min-max scaling) when you need the data to be within a specific range, such as neural networks or support vector machines.
- Use MaxAbsScaler when dealing with sparse data, such as text data or high-dimensional sparse features.
- Use RobustScaler when dealing with data sets containing outliers or non-normally distributed features.
Keep in mind that categorical features may need encoding (e.g., one-hot encoding) before applying feature scaling, especially if they’re nominal (unordered categories).
4. Handling Categorical Data
Categorical variables represent groups or categories and are often non-numeric in nature, posing challenges during model training, including:
- Non-numeric representation: Categorical variables are typically represented using strings or labels, which most machine learning algorithms cannot directly process. Algorithms require numeric inputs for training and predictions.
- Ordinal vs. nominal variables: Categorical variables can be either ordinal (with a meaningful order) or nominal (without a specific order). Treating ordinal variables as nominal or vice versa can lead to incorrect model interpretations or biased predictions.
- Curse of dimensionality: One-hot encoding, a common technique for handling categorical data, can lead to an increase in the dimensionality of the data set, especially with a large number of unique categories. This can impact model performance and increase computational complexity.
Techniques for Encoding Categorical Variables
Techniques for encoding categorical variables include:
Label encoding: Label encoding assigns a unique numerical label to each category in a categorical variable. It’s suitable for ordinal variables where there is a meaningful order among categories.
Here’s an example using Python's scikit-learn:
from sklearn.preprocessing import LabelEncoder
le = LabelEncoder()
encoded_labels = le.fit_transform(['cat', 'dog', 'rabbit', 'dog'])
One-hot encoding: One-hot encoding creates binary columns for each category in a categorical variable, where each column indicates the presence or absence of that category. It’s suitable for nominal variables without a specific order among categories.
Here’s an example using pandas:
import pandas as pd
df = pd.DataFrame({'category': ['A', 'B', 'C', 'A']})
one_hot_encoded = pd.get_dummies(df['category'], prefix='category')
Dummy encoding: Dummy encoding is similar to one-hot encoding but drops one of the binary columns to avoid multicollinearity issues in linear models. It’s commonly used in regression models where one category serves as a reference category.
Here’s an example using pandas:
dummy_encoded = pd.get_dummies(df['category'], prefix='category', drop_first=True)
Guidelines for Handling Categorical Data
To correctly handle categorical data, you should:
Understand variable types: Determine whether categorical variables are ordinal or nominal to choose the appropriate encoding technique.
Avoid ordinal misinterpretation: Be cautious when using label encoding for nominal variables, as it can introduce unintended ordinality in the data.
Deal with high cardinality: For categorical variables with a large number of unique categories, consider techniques like frequency encoding, target encoding, or dimensionality reduction techniques such as PCA.
This is all in addition to the already-mentioned handling of missing values and normalizing numerical data.
5. Dealing with Imbalanced Data
Dealing with imbalanced data is a common challenge in machine learning, especially in classification tasks where the number of instances in one class (minority class) is significantly lower than in the other classes (majority classes). Imbalanced data can have a profound impact on model training and evaluation, leading to biased models that favor the majority class and perform poorly on minority classes.
Here are some key points regarding imbalanced data and techniques for handling it:
Impact of Imbalanced Data on Model Performance
Models trained on imbalanced data tend to prioritize accuracy on the majority class while neglecting the minority class. This can lead to poor performance on minority class predictions. Also, metrics like accuracy can be misleading in imbalanced data sets, as a high accuracy may result from correctly predicting the majority class while ignoring the minority class. Evaluation metrics like precision, recall, F1-score, and area under the ROC curve (AUC-ROC) are more informative for imbalanced data sets compared to accuracy alone.
Techniques for Handling Imbalanced Data
The most common techniques for handling imbalanced data are oversampling and undersampling. Oversampling involves increasing the number of instances in the minority class to balance it with the majority class. Undersampling involves reducing the number of instances in the majority class to balance it with the minority class. You can also take a hybrid approach by combining oversampling and undersampling.
There’s also class weighting, where you adjust class weights during model training to penalize errors on the minority class more than errors on the majority class. This is only useful for algorithms that support class weighting, such as logistic regression or support vector machines.
Guidelines for Handling Imbalanced Data
To handle imbalanced data, you should:
Understand data distribution: Analyze the class distribution in your data set to determine the imbalance severity.
Choose the appropriate technique: Select the oversampling, undersampling, or hybrid technique based on your data set size, imbalance ratio, and computational resources.
Evaluate metrics: Use appropriate evaluation metrics like precision, recall, F1-score, or AUC-ROC curve to assess model performance on both classes.
Cross-validate: Apply techniques within cross-validation folds to avoid data leakage and obtain reliable model performance estimates.
Conclusion
Data preprocessing helps ensure ML models are trained on high-quality, properly formatted data, which directly impacts the model's performance, accuracy, and generalization ability. By addressing issues like missing values, outliers, categorical variables, and class imbalance, data preprocessing enables models to make more informed and accurate predictions, leading to better decision-making in real-world applications.
With proper data preprocessing, ML practitioners can unlock the full potential of their data and build more accurate and reliable predictive models for various applications across domains.
However, to truly do that in the real world, you first need to have a flexible data storage solution such as Pure Storage that helps you accelerate AI and machine learning and get ahead with your enterprise AI initiatives.